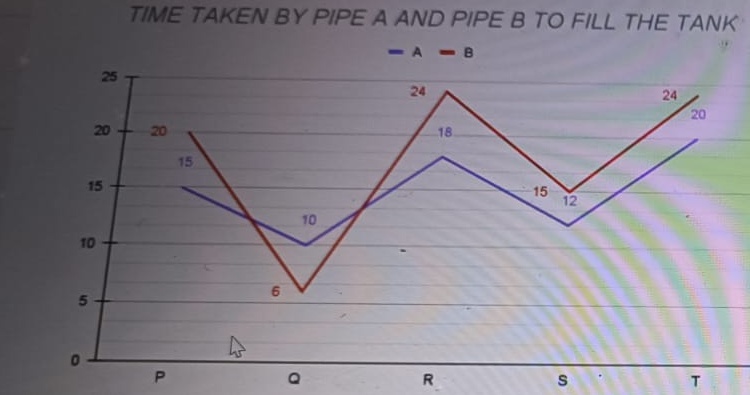
Direction: The line graph shows the time (in hours) taken by two pipes A and B to fill...
Texas Instruments aptitude question with a worked answer. Free to practise - no sign-up.
Direction:** The line graph shows the time (in hours) taken by two pipes A and B to fill tanks P, Q, R, S and T.
Question: The capacity of the tank P is 480 liters. If both pipes A and B are opened simultaneously and closed after 5 hours, then how much more water is needed to fill the tank fully?
Show answer & explanation
Read Values from the Line Graph for Tank P**:
- Time taken by Pipe A (blue line) to fill Tank P = $15\text{ hours}$.
- Time taken by Pipe B (red line) to fill Tank P = $20\text{ hours}$.
Calculate Hourly Flow Rates:
- Given total capacity of Tank P = $480\text{ liters}$.
- Flow rate of Pipe A: $R_A = \frac{480}{15} = 32\text{ liters/hour}$.
- Flow rate of Pipe B: $R_B = \frac{480}{20} = 24\text{ liters/hour}$.
- Combined flow rate when both pipes are open:
$$R_{A+B} = 32 + 24 = 56\text{ liters/hour}$$
Volume Filled in 5 Hours:
$$V_{\text{filled}} = 56\text{ liters/hour} \times 5\text{ hours} = 280\text{ liters}$$Calculate Additional Water Needed:
$$\text{Remaining Volume} = 480 - 280 = \mathbf{200\text{ liters}}$$
Thus, $200\text{ liters}$ more water is needed to fill the tank fully. Correct option is C.