Direction: Study the information given below and answer the question that follows: An...
Texas Instruments aptitude question with a worked answer. Free to practise - no sign-up.
Direction:** Study the information given below and answer the question that follows:
An organization has different numbers of branches in 5 different states of India, i.e., WB, UP, MP, JH, and TN. The pie charts given below represent two quantities: 'Number of employees' and 'Number of branches'.
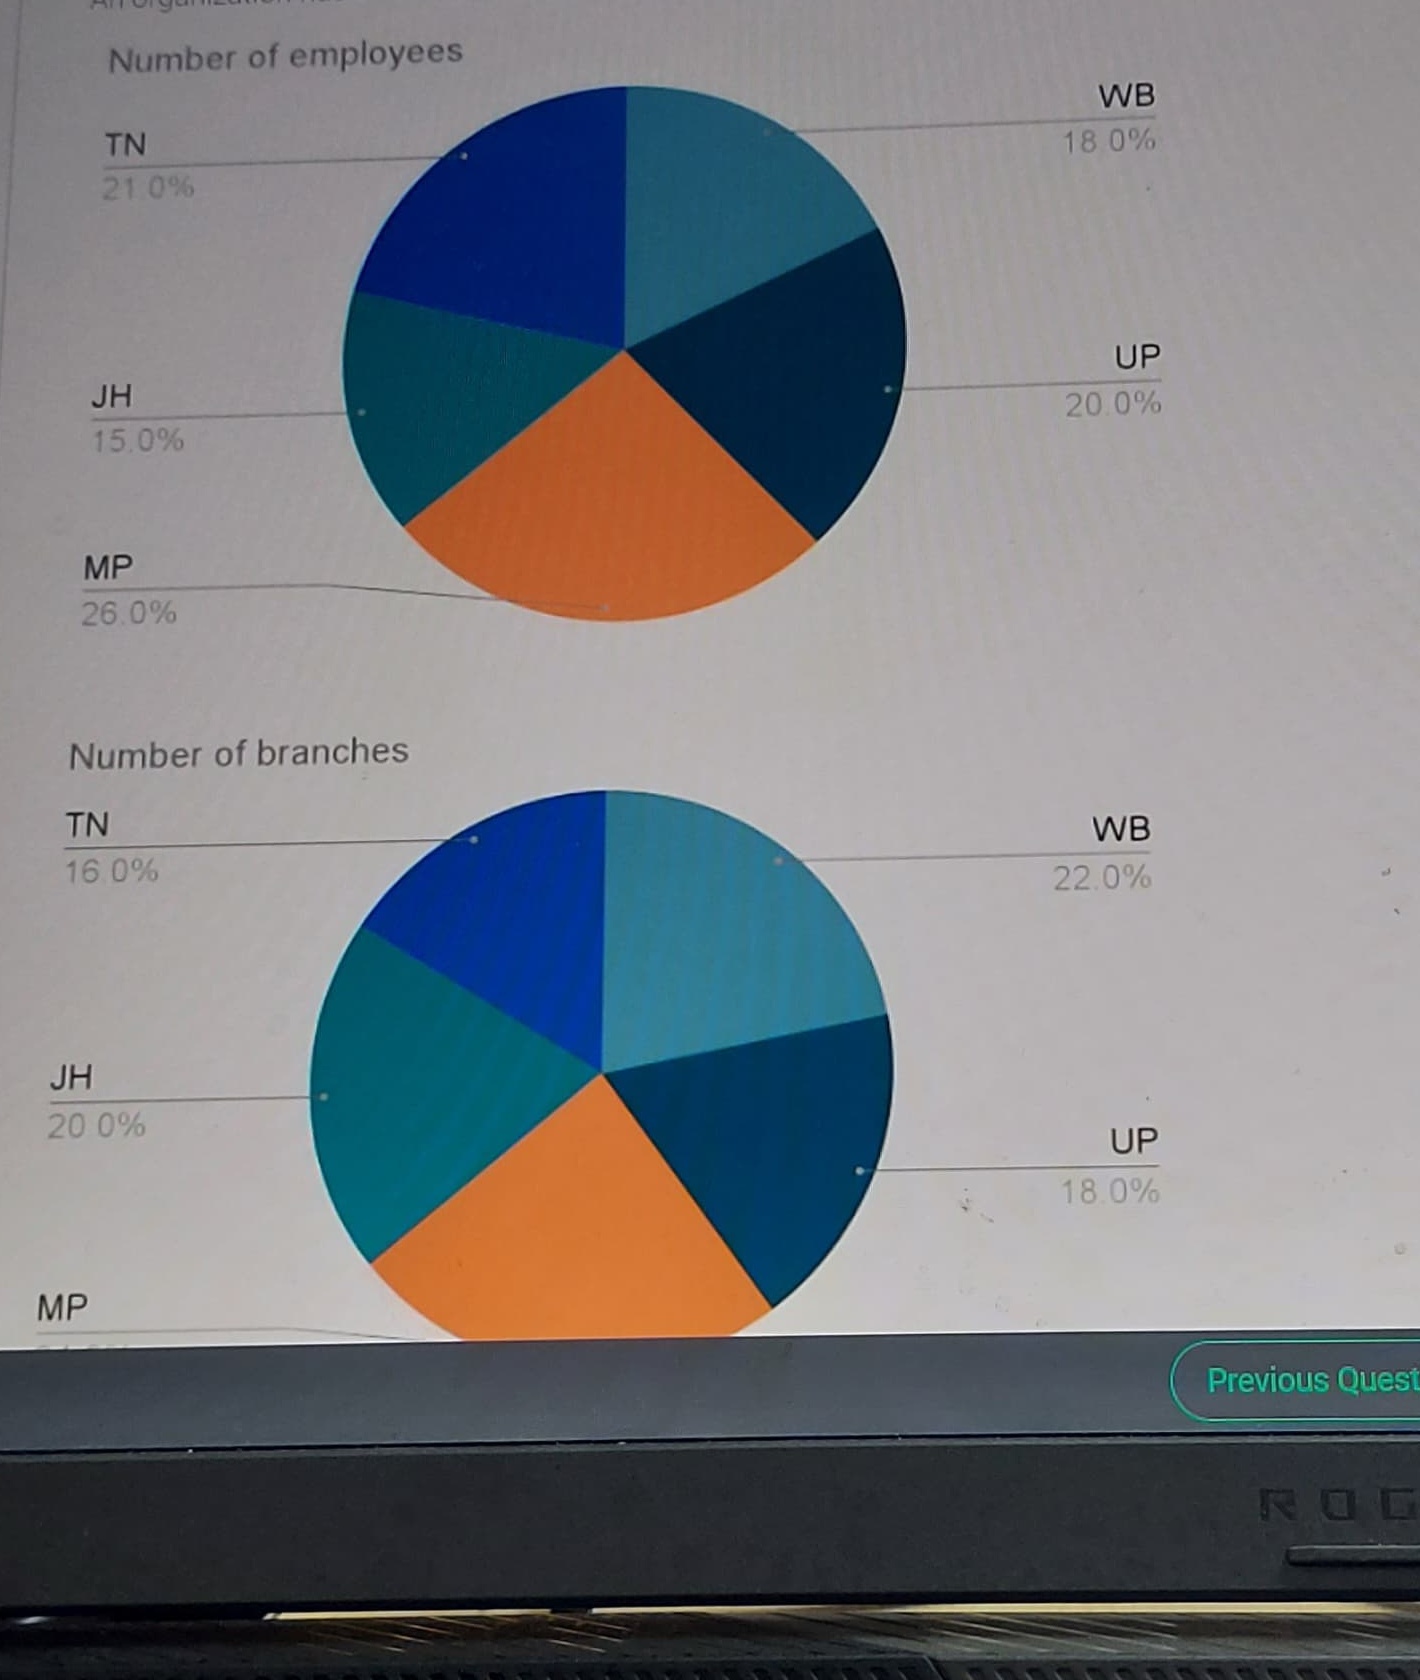
Note: All the branches of each state have the same employee strength.
Question: Which state has got the maximum number of employees per branch?
Show answer & explanation
Answer: B. TN
Mathematical Formulation**:
- Let total employees in the organization be $E$.
- Let total branches in the organization be $B$.
- For any state $S$, let $p_S$ be the percentage of total employees and $q_S$ be the percentage of total branches.
- The average number of employees per branch in state $S$ is:
$$\text{Strength}_S = \frac{p_S \times E}{q_S \times B} = \left(\frac{p_S}{q_S}\right) \times \frac{E}{B}$$ - Because $\frac{E}{B}$ is a positive constant across all states, the state with the maximum employees per branch corresponds to the state with the maximum ratio $\frac{p_S}{q_S}$.
Extract Percentages from the Pie Charts:
- TN: Employees = $21.0%$, Branches = $16.0% \implies \frac{21}{16} = \mathbf{1.3125}$
- UP: Employees = $20.0%$, Branches = $18.0% \implies \frac{20}{18} = \frac{10}{9} \approx 1.111$
- MP: Employees = $26.0%$, Branches = $24.0% \implies \frac{26}{24} = \frac{13}{12} \approx 1.083$
- WB: Employees = $18.0%$, Branches = $22.0% \implies \frac{18}{22} = \frac{9}{11} \approx 0.818$
- JH: Employees = $15.0%$, Branches = $20.0% \implies \frac{15}{20} = 0.750$
Conclusion:
- Comparing the ratios: $\mathbf{1.3125} > 1.111 > 1.083 > 0.818 > 0.750$.
- Therefore, TN has the highest number of employees per branch.
Thus, the correct option is B.