The given bar graph shows the total number of members enrolled in gymnasiums A and B from...
Texas Instruments aptitude question with a worked answer. Free to practise - no sign-up.
The given bar graph shows the total number of members enrolled in gymnasiums A and B from 1990 to 1994.
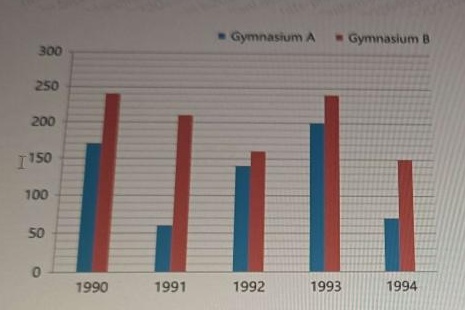
For both gymnasiums A and B, it was observed that in the year 1995, there was a 30% increase in the total number of members enrolled in comparison to the total enrollment in 1994.
Find the total number of members enrolled in 1995.
Show answer & explanation
Answer: D. 286
In 1994, Gymnasium A enrolled approx 70 members and Gymnasium B enrolled approx 150 members, giving a total of 220 members. With a 30% increase in 1995, the total enrollment is 220 * 1.30 = 286.