The line chart below shows the ratio of Imports to Exports of cars by Hyundai over the...
Qualcomm aptitude question with a worked answer. Free to practise - no sign-up.
The line chart below shows the ratio of Imports to Exports of cars by Hyundai over the period from 2001 to 2007:
$$\text{Ratio} = \frac{\text{Imports}}{\text{Exports}}$$
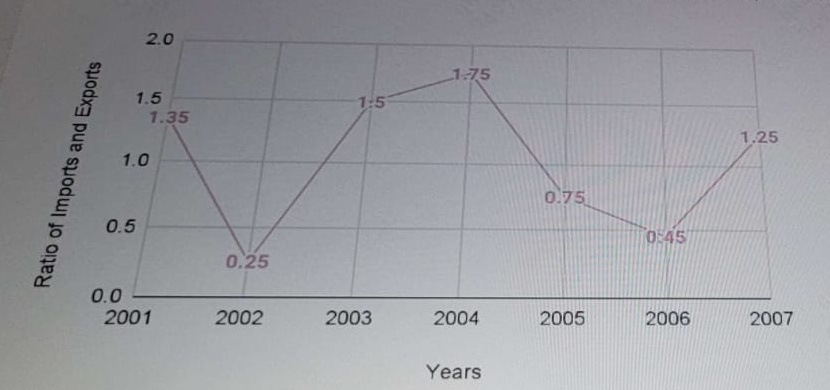
In how many of the given years were the exports more than the imports?
Show answer & explanation
Answer: B. 3 years
Exports exceed imports when the Ratio = Imports / Exports < 1.0. Looking at the chart, the ratio is below 1.0 in 2002 (0.25), 2005 (0.75), and 2006 (0.45), totaling 3 years.