Direction: Study the line chart below showing the ratio of Imports to Exports of cars by...
Qualcomm aptitude question with a worked answer. Free to practise - no sign-up.
Direction: Study the line chart below showing the ratio of Imports to Exports of cars by Hyundai over the period 2001–2007, and answer the question that follows.
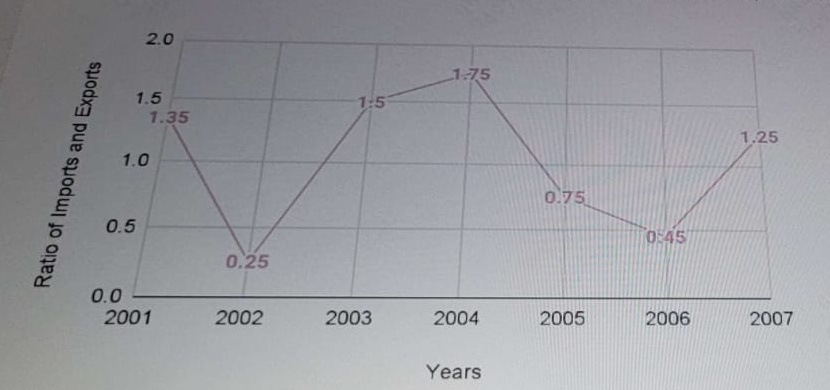
In how many of the given years were the exports more than the imports?
Show answer & explanation
Answer: B. 3 years
The plotted ratio is:
$$\text{Ratio} = \frac{\text{Imports}}{\text{Exports}}$$
If $\text{Exports} > \text{Imports}$, then $\frac{\text{Imports}}{\text{Exports}} < 1.0$.
From the chart, the ratios across the years are:
- 2001: $1.35 > 1$
- 2002: $0.25 < 1$ (Exports > Imports)
- 2003: $1.50 > 1$
- 2004: $1.75 > 1$
- 2005: $0.75 < 1$ (Exports > Imports)
- 2006: $0.45 < 1$ (Exports > Imports)
- 2007: $1.25 > 1$
Thus, exports exceeded imports in 3 years (2002, 2005, and 2006).