Direction: Study the line chart below showing the ratio of Imports to Exports of cars by...
Qualcomm aptitude question with a worked answer. Free to practise - no sign-up.
Direction: Study the line chart below showing the ratio of Imports to Exports of cars by Hyundai over the period 2001–2007, and answer the question that follows.
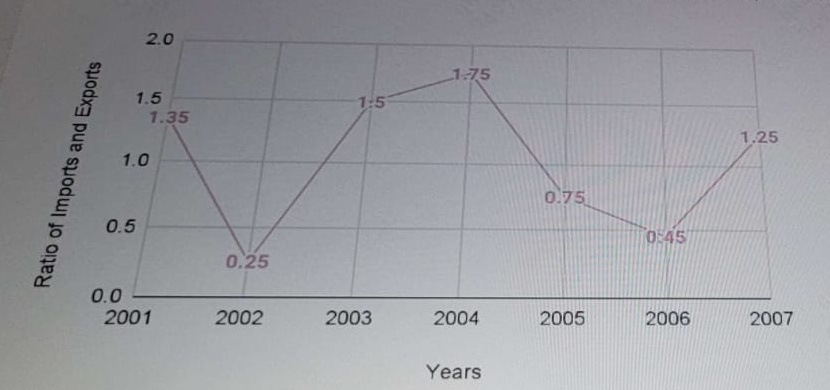
The imports were minimum proportionate to the exports of Hyundai in which of the following years?
Show answer & explanation
Answer: B. 2002
The question asks for the year in which the ratio $\frac{\text{Imports}}{\text{Exports}}$ was minimum.
Inspecting the data points from the chart:
- 2001: $1.35$
- 2002: $0.25$ (Global Minimum)
- 2003: $1.50$
- 2004: $1.75$
- 2005: $0.75$
- 2006: $0.45$
- 2007: $1.25$
The lowest ratio is $0.25$ in the year 2002.