Direction: Study the following bar graph and answer the question that follows: The bar...
Qualcomm aptitude question with a worked answer. Free to practise - no sign-up.
Direction:** Study the following bar graph and answer the question that follows:
The bar graph shows the percentage of students who took Hindi, English or Sanskrit as optional subjects from 2015 to 2019.
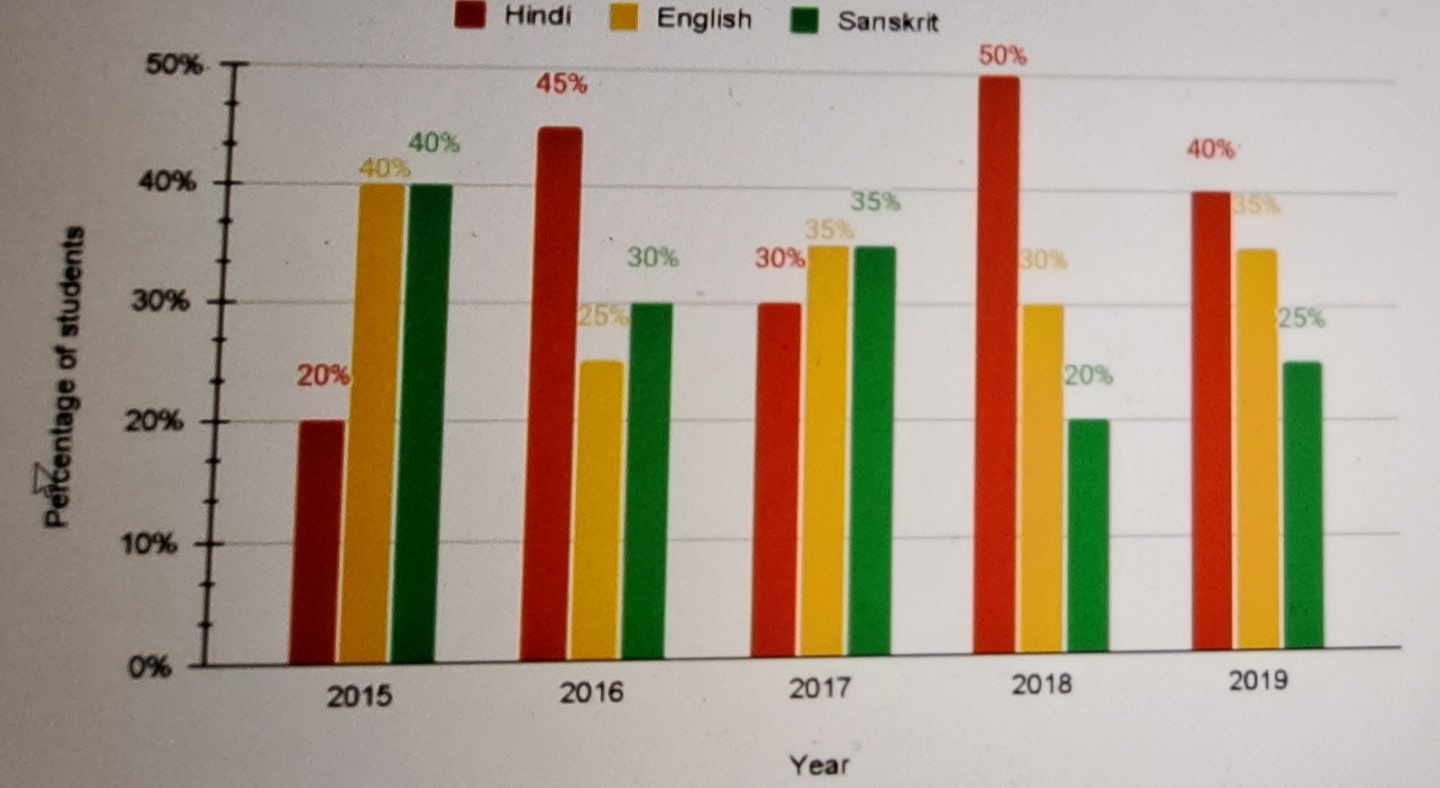
Question: What is the average number of students who took English from 2016 to 2018, if the total number of students in each year was 500?
Show answer & explanation
From the given bar graph, we extract the percentage of students opting for English (yellow bar):
- 2016: $25%$
- 2017: $35%$
- 2018: $30%$
Given that the total number of students in each year was $N = 500$:
- Number of English students in 2016: $25% \times 500 = 0.25 \times 500 = 125$
- Number of English students in 2017: $35% \times 500 = 0.35 \times 500 = 175$
- Number of English students in 2018: $30% \times 500 = 0.30 \times 500 = 150$
The average number of students across these three years is:
$$\text{Average} = \frac{125 + 175 + 150}{3} = \frac{450}{3} = \mathbf{150}$$
Alternatively, calculating the average percentage first:
$$\text{Average Percentage} = \frac{25% + 35% + 30%}{3} = \frac{90%}{3} = 30%$$
$$\text{Average Number} = 30% \times 500 = \mathbf{150}$$
Thus, the correct option is B.