Direction: Study the following bar graph and answer the question that follows: The bar...
Qualcomm aptitude question with a worked answer. Free to practise - no sign-up.
Direction:** Study the following bar graph and answer the question that follows:
The bar graph shows the percentage of students who took Hindi, English or Sanskrit as optional subjects from 2015 to 2019.
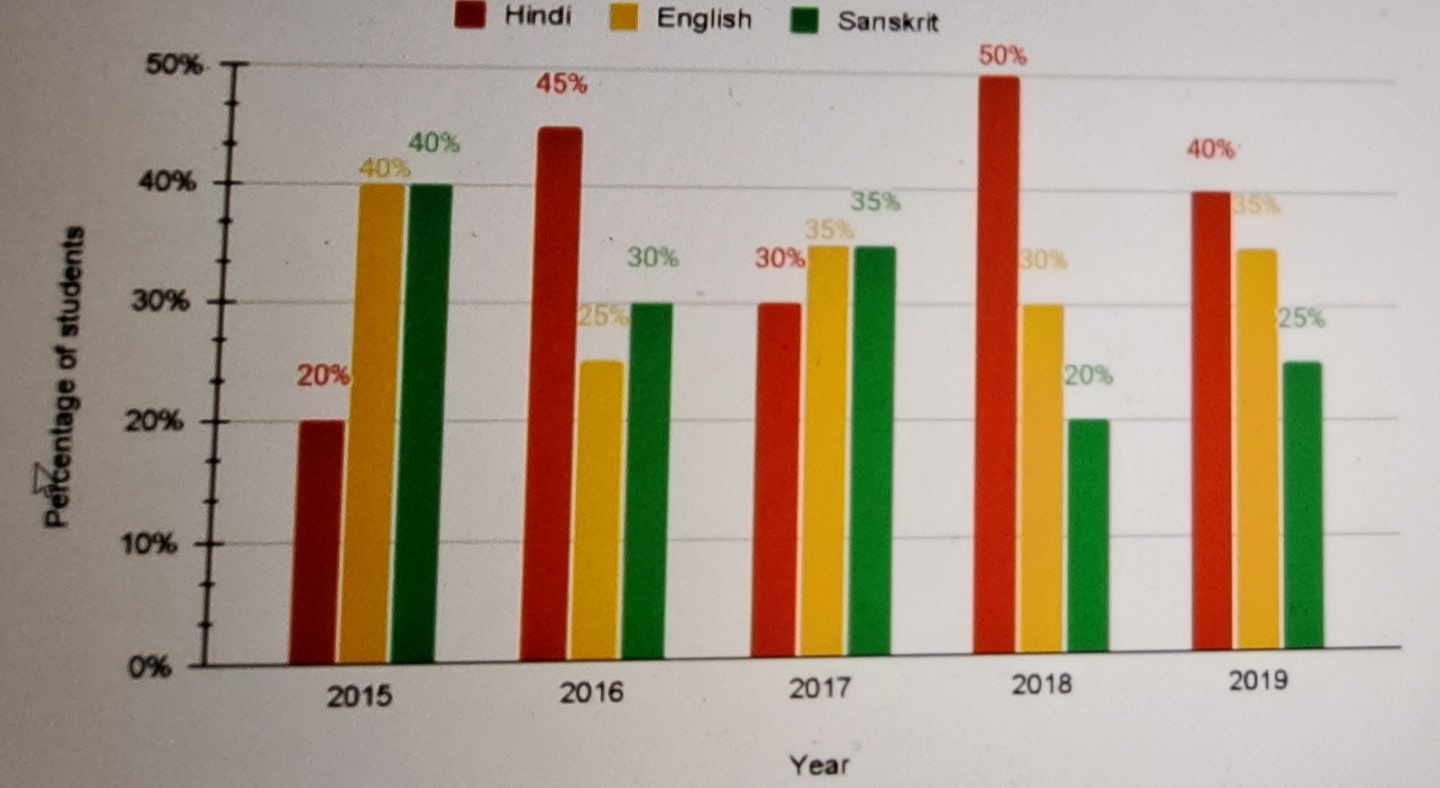
Question: The total number of English students in 2016 and 2018 together was 665 and the total number of students in 2018 was 200 more than that of 2016. What was the total number of students in 2016 and 2018 together?
Show answer & explanation
Define Variables**:
- Let the total number of students in 2016 be $x$.
- Then the total number of students in 2018 is $x + 200$.
Extract Percentages from Graph:
- Percentage of English students in 2016 = $25% = 0.25$.
- Percentage of English students in 2018 = $30% = 0.30$.
Formulate and Solve Equation:
$$\text{English}{2016} + \text{English}{2018} = 665$$
$$0.25x + 0.30(x + 200) = 665$$
$$0.25x + 0.30x + 60 = 665$$
$$0.55x = 605$$
$$x = \frac{605}{0.55} = 1100$$Calculate Totals:
- Total students in 2016: $N_{2016} = 1100$
- Total students in 2018: $N_{2018} = 1100 + 200 = 1300$
- Total number of students in 2016 and 2018 together:
$$N_{2016} + N_{2018} = 1100 + 1300 = \mathbf{2400}$$
Thus, the correct option is D.